
Most local retailers have run the same mental calculation for years: more customers equals more revenue. So every euro of marketing budget points outward - toward new faces, new foot traffic, new clicks. Meanwhile, a completely different number sits untouched inside every transaction record: how often a customer who buys one thing also buys a second. That number is called your attach rate, and for the majority of independent retailers, it has never been calculated once. The business case for fixing that is not subtle. A customer who already has their wallet out costs you nothing extra to convert. Nudging them toward a second item is the cheapest revenue your business can generate - and right now, it is almost certainly leaking away silently, one single-item transaction at a time.
The Three Levers of Revenue (And Why Two of Them Are Being Ignored)
Revenue in any retail business is the product of three variables: how many customers you have, how often they visit, and how much they spend per visit. Almost every independent retailer invests time and money on the first lever - acquisition - and occasionally thinks about the second - retention. The third lever, basket size, rarely gets deliberate attention. That is a structural mistake. Increasing average order value by 15% across existing traffic is arithmetically equivalent to growing your customer base by 15% - with zero acquisition cost, zero new marketing spend, and no extra footfall required. The constraint is not opportunity; it is awareness. Most owners simply do not know which products are already drifting into the same basket, because they have never looked.
How to Find Your Hidden Product Pairings in Under an Hour
You do not need a data analyst or a complex dashboard to do this. What you need is access to your transaction-level history - most modern POS systems can export this as a spreadsheet - and about 45 minutes of focused attention. Here is the exact process, in order.
- Export 90 days of individual transaction records from your POS, with each line showing the specific items in each transaction, not just the total.
- Filter for transactions with two or more line items - these are your multi-item baskets, and they are where the attach pattern lives.
- Sort by your ten highest-volume individual products. For each one, scan which second item appears most frequently in the same transaction.
- Write down the top three pairings you find. You are looking for naturally recurring combinations the data has surfaced - not what you think should go together, but what already does.
- Calculate a rough attach rate: of all the transactions containing Product A, what percentage also include Product B? Even a 12% natural attach rate is a meaningful commercial signal.
- Flag any pairing where the attach rate is above 10% but there is no intentional display, suggestive-selling prompt, or bundle offer currently built around it. That gap is your opportunity.
The best product recommendation you will ever make is one your own data has already validated. You are not guessing - you are confirming a pattern that real customers are already showing you.
Turning a Data Pattern into a Selling Habit
Finding the pairing is step one. Building a simple, repeatable habit around it is where the revenue actually appears. The good news is that this does not require a new system, new staff training, or a complicated workflow. It requires three specific interventions, any one of which will move the number.
Three Interventions That Actually Change Basket Size
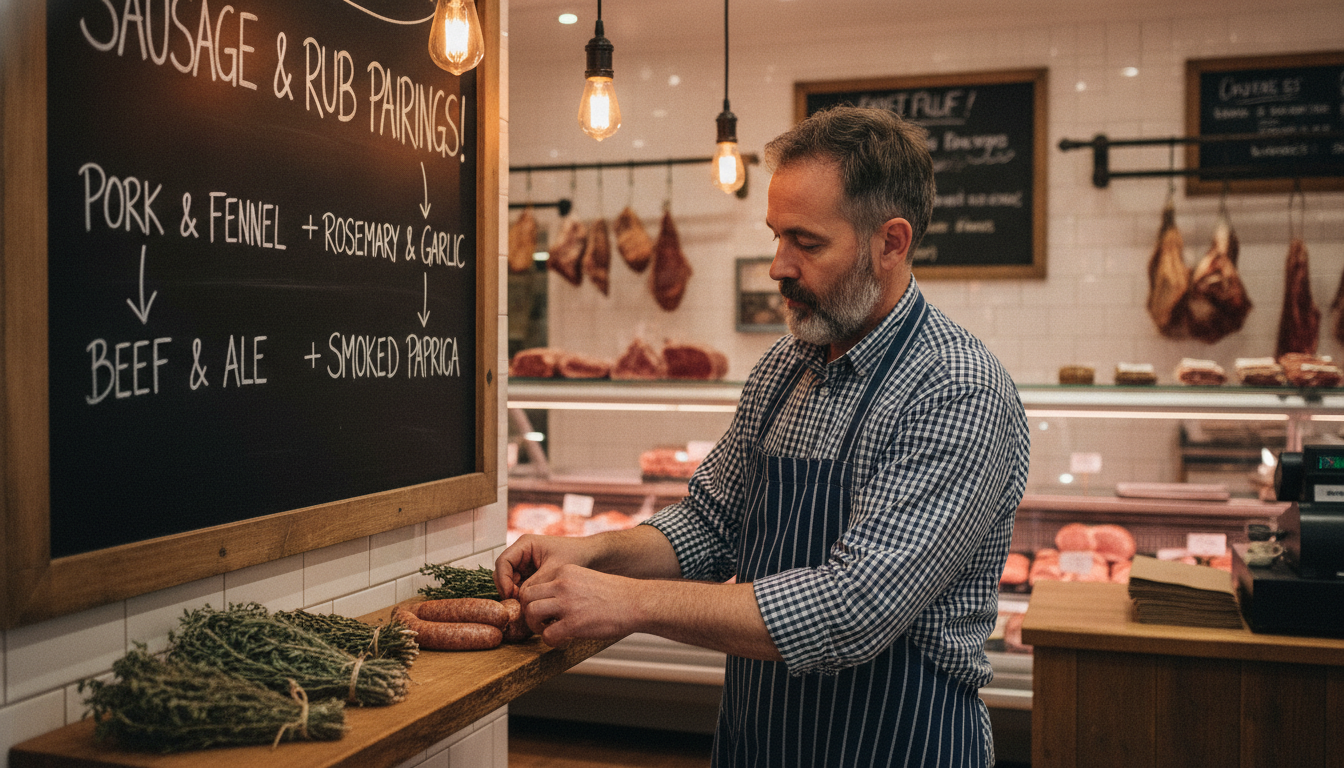
First, proximity merchandising: physically move the paired product next to its natural companion on the shelf or counter. Retail research consistently shows that co-location alone lifts attach rates without a single word being said by staff. Second, a point-of-sale prompt: a simple handwritten or printed card near the checkout reading 'Customers who buy X often pick up Y too' is low-effort and surprisingly effective at the moment of maximum purchase intent. Third, a bundled price: you do not need a discount to create a bundle - a named pairing with a clear combined price reduces the cognitive effort of the buying decision and subtly anchors the two-item spend as the standard choice. Start with one pairing, run it for four weeks, and measure whether your average transaction value shifts. The measurement is what turns a one-off experiment into a permanent system.
When Your Transaction Data Becomes Your Marketing Brief
The same product pairing you surface in your spreadsheet exercise does not have to stay inside your shop. It is also one of the sharpest possible briefs for a local marketing campaign - because it is grounded in real buying behaviour rather than intuition. A post built around 'these two things belong together' outperforms a generic product announcement because it reflects something true about how your customers already shop. For retailers connecting their POS data to a platform like Rulrr, those combinations move from a manual spreadsheet exercise into automated campaign briefs, with the pairing logic informing content and targeting directly. The data that lives in your transactions becomes the input for what goes out to your audience - which is a more honest starting point for marketing than most owners ever have access to.

The Number to Watch Going Forward
Once you have run this exercise once, the habit to build is simple: pull your average items-per-transaction figure monthly and track it alongside your average order value. Most independent retailers run an items-per-transaction figure somewhere between 1.3 and 1.8. Moving that number by 0.2 across a month of transactions is not a marginal improvement - at any reasonable ticket size, it compounds into thousands of euros of revenue generated with zero additional acquisition spend. Your transaction history has been recording this opportunity every single day you have been trading. The only thing that changes today is that you start reading it.